


Oct 8, 2025


Oct 8, 2025


Oct 7, 2025


Oct 7, 2025


Oct 7, 2025


Oct 7, 2025

Once upon a time, maps were shaped by a sheet of paper on a brown table, a pencil at the edge, and a thoughtful engineer at the helm. Today, this scene has become digital. Digital maps displayed on computer screens are no longer just directions; they have become intelligent systems that encode the future of cities, disaster risks, and infrastructure. So how are these digital maps produced? The answer lies in the seamless integration of multiple technologies: CAD and GIS software, field data, aerial imagery, and high-precision laser scanners are the key components that form the backbone of this process. In this article, we will examine the fundamental stages of digital map production: the data collection, processing, and presentation cycle, step by step, using CAD and GIS-based systems.
Digital map production begins with data collection . A map is not simply a computer drawing; it is created using actual measurements on the ground. For example, to create a digital base map of a region, all terrain features such as roads, buildings, sidewalks, walls, and wells are measured using instruments such as GNSS and total stations. The TUSAGA-Active GNSS network of 158 fixed stations in Turkey provides real-time correction data and provides centimeter-level precision.

Terrestrial Measurement: Ground measurements taken with GNSS receivers and measuring instruments ensure map accuracy. These measurements are arranged at a scale of 1/1000 or 1/5000, providing a physical measurement of the map's framework.
Aerial Photogrammetry: Aerial photographs taken by aircraft or drones are combined to create a 3D surface model and orthophoto (a scaled satellite-like image). Digital photogrammetry is a method that combines the principles of classical photogrammetry with digital image processing techniques. This method allows for the automatic creation of surface models and slope analyses for curved terrain, building roofs, or large agricultural fields in just a few steps.
LIDAR Scanning: Laser scanning from an aircraft or drone produces a point cloud (XYZ coordinates) of the surface. LiDAR can even detect terrain beneath vegetation. LiDAR offers significant advantages, particularly in producing high-resolution digital surface models (DSM); however, the flight and data processing costs of these systems are considerably higher than other methods. However, photogrammetry may be insufficient to detect subsurface details in forested areas due to dense vegetation.

Satellite Imagery and Other Sources: High-resolution satellite imagery is an important resource for mapping, especially when large areas require rapid analysis. Geographic information bases, topographic maps, or existing GIS data can also be considered as sources. All these sources are organized into a common coordinate system before being imported into CAD/GIS software.
Think of the data collection process like a movie set: While the team is on the ground taking measurements, drones are flying overhead. Every camera frame, every GPS point, creates a piece of the digital map. After this stage, CAD and GIS software come into play.
Once the data is collected, it's time to draw the objects on the map . This is where CAD (Computer-Aided Design) software comes in. CAD stands for "computer-aided design" and incorporates computers into the design process. With CAD software in mapping:
Point and Line Construction: Each element—road, building, river, roadside sign—is rendered as a polygon or line (vector) in the CAD environment. CAD software digitally processes every measurement taken from the field with high precision.
Layer-by-Layer Editing: CAD mapping projects use layers. For example, buildings are drawn on a separate layer, and roads on a separate layer. This prevents confusion; different information, such as infrastructure, geology, or vegetation, can be turned on or off as needed.
Scale and Accuracy: When working in a CAD environment, the drawing scale can be precisely determined by the user. Surveyors generally prefer larger scales such as 1/1000 or 1/5000. At these scales, real-world features on the field (buildings, roads, wells, etc.) are transferred to the digital environment at exact measurements and drawn with full detail.
Consider the computer screen: a magical city is being built in CAD with lines, points, and symbols. Toolsets like AutoCAD Map 3D transform a CAD drawing into a full-fledged GIS (geographic information system) mapping tool . According to Autodesk's own description, AutoCAD Map 3D is a "model-based GIS mapping software" that allows simultaneous access to CAD and GIS data. This means that surveyors can both create precise drawings and add data layers for geographic analysis within this environment.
For example, Netcad GIS , a widely used domestic software in Turkey, offers similar CAD and GIS integration. At this point, CAD becomes a digital production space where surveying engineers shape their engineering decisions. Every line on the screen is precisely shaped by field data and becomes a digital reflection of technical knowledge and planning vision.

After preparing the drawings, it's time to add meaning to the map: GIS (Geographic Information System) applications come into play. GIS is an information system that enables the collection, storage, processing, and presentation of location-based (spatial) data to users. In other words, lines created with CAD become semantic in the GIS environment.
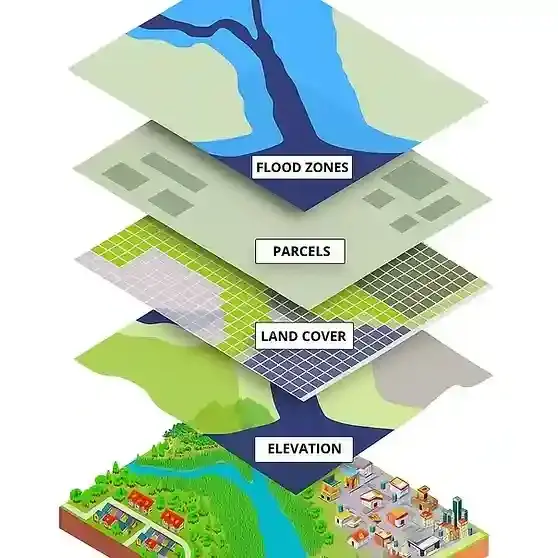
Data Integration: Data from different sources (infrastructure, population, land use, etc.) is combined. GIS links these layers by superimposing them on the interface. For example, by adding electrical grids or sewer lines to the infrastructure layer on a city map, you can transform the map from mere shapes into a meaningful structure containing multi-layered information.
Query and Analysis: The map is a queryable database. Questions like, "How many buildings are there within a 100-meter radius of this road?" and "Which areas are at risk when the rainfall map and the landslide risk map are superimposed?" are answered with GIS. Geographic analysis, distance calculations, buffer zone analysis, and spatial filtering are performed at this stage.
Presentation and Reporting: The prepared geographical analysis results are presented in different thematic maps (heat
map, classified maps). Furthermore, data can be stored as a database in a GIS environment, creating an infrastructure for cartography.
Here's another analogy: While CAD constructs a map geometrically, GIS transforms that map into a living network of information. If CAD draws a shape, GIS adds population, infrastructure, or environmental data to that shape, transforming it into multilayered data. In this way, the map becomes not just a pattern on paper but a source of meaningful geographic information .
Many specialized software and tools are used in map production. Below are some sample categories:

CAD-Based Mapping Software: Programs such as AutoCAD Map 3D, Civil 3D, Bentley MicroStation , and Netcad GIS as native solutions. AutoCAD Map 3D, in particular, enables working with both CAD and GIS data.
Photogrammetry Software: For creating 3D models from aerial photographs and drone imagery: Popular software includes Agisoft Metashape, Pix4D, ERDAS IMAGINE, Leica Photogrammetry Suite, and Trimble Inpho . These tools align hundreds of photos, generate point clouds, and generate orthophotos.
LIDAR Processing Tools: Specialized packages such as TerraScan, LP360 are used to manage the collected point cloud.
GIS/GIS Software: Esri ArcGIS (ArcGIS Pro/ArcGIS Desktop), QGIS, MapInfo , etc. These software are used to query maps, analyze them, and create the final map product.
General Data Processing: Tools such as Global Mapper and FME are preferred for data conversions and preprocessing in different formats.
Data Collection Equipment: Drones and GNSS equipment are indispensable for the data collection phase.

CAD and GIS software are two complementary components of the map production process. One ensures drawing and measurement precision, while the other adds meaning and analytical power to the data. For example, the image above shows a GIS application and geographic layers. These software manage drawings and analytical data together.
This wide range of software and tools provides surveying engineers with significant operational flexibility in developing project-specific solutions. Furthermore, many software programs can be interconnected. For example, data exchange between CAD and GIS is possible with FDO technology between ArcGIS and AutoCAD Map3D. This allows engineers to both create precise drawings and update their geographic databases. Software selection varies depending on the project's needs, but CAD programs remain the primary choice. Netcad GIS, one of Turkey's domestically developed examples, is defined as "CAD/GIS technology designed for engineering and geographic information systems users, supporting international standards."
Today, digital maps have become indispensable tools that provide solutions to real-life problems in many sectors.
In disaster management, intervention plans can be prepared in advance thanks to maps created for risks such as earthquakes or floods.
In urban planning, new transportation lines or zoning decisions are shaped by the analysis of various data layers.
In infrastructure management, water and energy networks are modeled digitally to speed up maintenance processes.
In agriculture, vegetation analysis and precision irrigation systems increase production while also ensuring the sustainability of natural resources.
In environmental protection, critical steps such as erosion monitoring or dam area planning are transformed into data-supported decisions thanks to GIS analysis.
In short, digital maps are no longer just location-finding tools; they are becoming the cornerstones of decision support systems, sustainable development, and quality of life.
In conclusion, an ordinary map is actually the fruit of advanced technology. From field measurement to printed page, CAD and GIS software are the heroes of this process. The next time you look at a map, remember the complex yet fascinating journey behind it. Perhaps an ordinary line will now hold the key to a new world.


Comments